HMI persistent graphing; "Unable to find HistoryID for variable"; Mervis DB key:value pairs?
-
I am trying to build a web HMI based control panel for my project. As it happens I need to have a bunch of seperate control pages in which I want to graph some variables over time. Currently I can get a chart to work if I open one page and leave it open, so I assume the rendering and data storage is being done by the front end. But if I reload the page the chart starts out empty again.
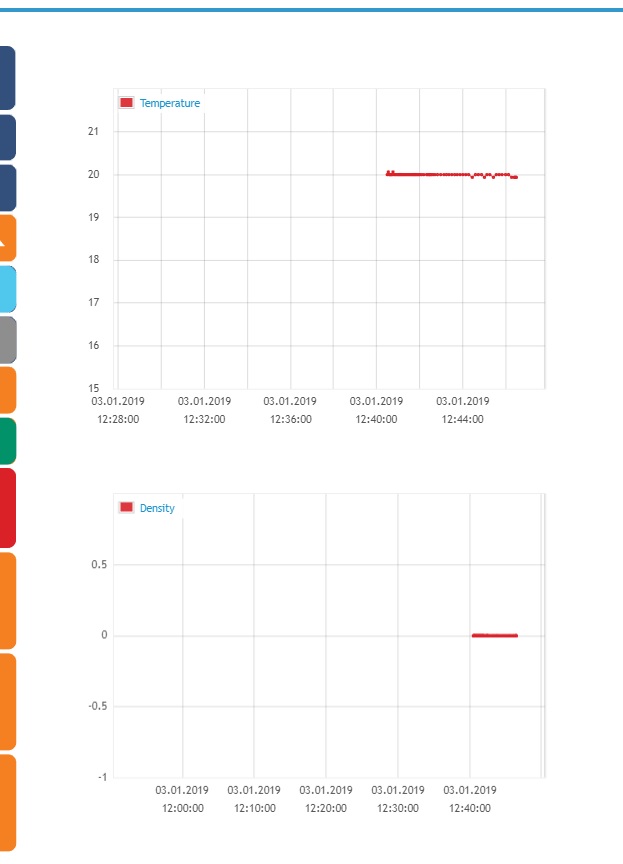
Here you can see the graphing is working:

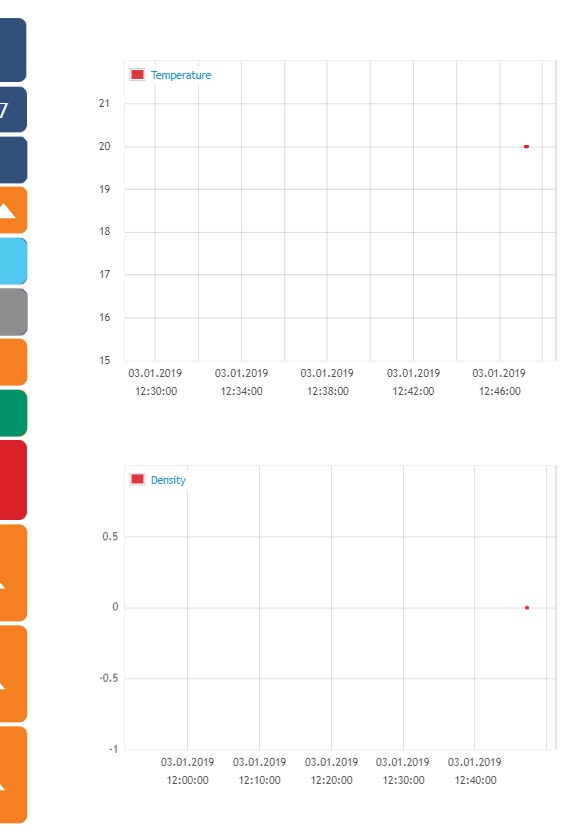
But after reloading the page the values are wiped:

I would like to know if there is any way of having the graphs for each variable update and keep older values without needing the page to be open all the time.
Another issue that may or may not be related to this is the fact that whenever I compile the solution I get the following error:


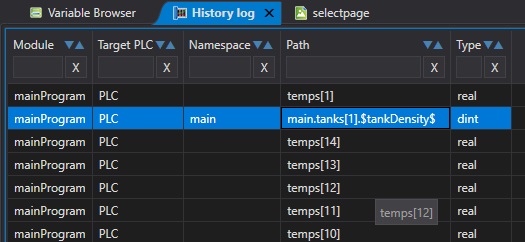
Even though the variables are imported in the history log:

Same goes for the other variable being graphed. The "density" one is an attribute to a function block, the "temperature" one is a global variable.
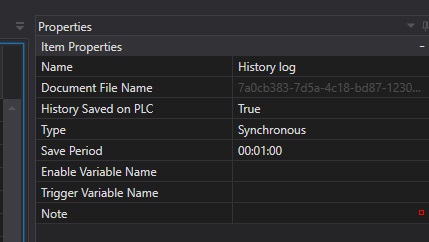
These are the properties of the history log:

EDIT: I see that a similar issue has been addressed as persistent data only being available in the database. Is this something that is going to change anytime soon?
EDIT 2: In the case of having to use the Mervis database, I am afraid the knowledge base is again frustratingly unclear on what is meant by the "key value pairs". Nowhere is it specified what all the required keys and values are. After filling out the login credentials and putting in the runtime id as shown in the example all I get is "error 100: unknown error". Since the tutorial at https://kb.unipi.technology/en:sw:01-mervis:storing-data-to-mervis-db-hidden doesn't mention anything about requiring keys or values it must either be out of date or missing something.
-
Hello @clueless
The longterm persistent data will newe be stored to the PLC since the PLC storage is not designed for such purpose. So right now, you will only see the values in the graph since the load of the page. In the future, the graph widget might be able to read the data from the online DB but that's just an idea.
The tutorial on the KB is written as a step by step guide which covers all steps that need to be done in order to make it work. What do you mean by "key value pairs"? If you are getting an error when trying to login to the DB viewer and filled incorrect credentials, then there is no data yet in the database. Check in the System status while in Debug mode that there are actually data sent to the DB. Also, make sure that the Network settings are correct so that the PLC has a connection to the Internet and can resolve DNS names.
-
@tomas_hora Ok, sorry, the issue with the database was something i had bungled myself.