Mervis HMI Help
-
@TriathletC Like @Iogo said, only the trend = a realtime graph is possible in Mervis HMI right now. But to every Neuron licence, you get a free use of 10 datapoints in the MervisDB including the online view... Have you tried that?
-
@tomas_hora !
I have not tried it yet.
It is basically the sheet you gave me just bought the UNIPI ..
In a nutshell, provide a space on your right server?But what I can not do is like setting HMI to insert the point to show in the chart..how HMI tutorial is not there ...
-
@TriathletC Yes, we provide 10variables to be stored for free, if more variables is stored, than it is paid. You also get a 1 Proxy ID to be able to connect to the UniPi remotely and change the program behavior.
I do not understand this: But what I can not do is like setting HMI to insert the point to show in the chart..how HMI tutorial is not there ...
-
@tomas_hora
I do not know how to enter the parameters and where to make a graph .. help me with courtesy. Thank you
-
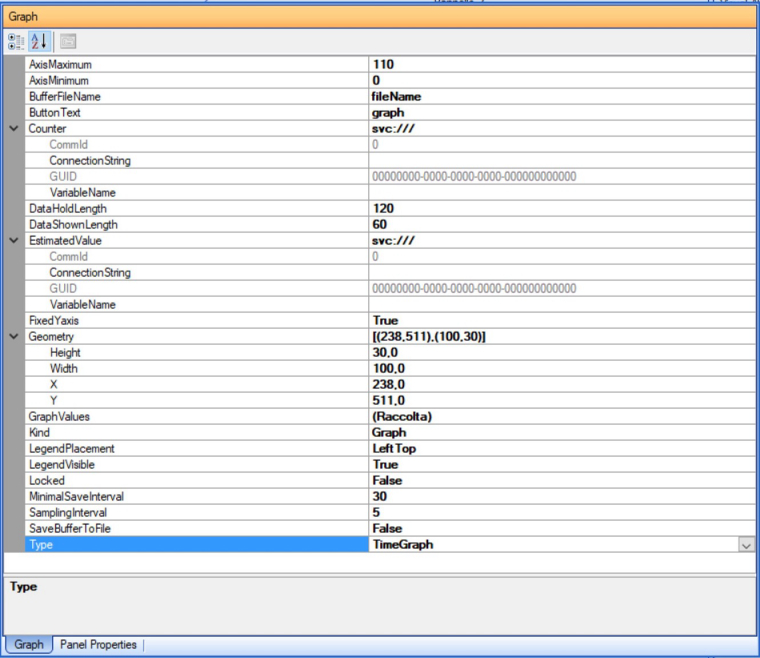
@TriathletC If you want simple graph just in collumn GraphValues click on "(Raccolta)". There Add and Attach variable which you want to show. Necessary is to set Axis Maximum and Axis Minimum. For this reasonis better to use Mervis DB.
-
Help me..
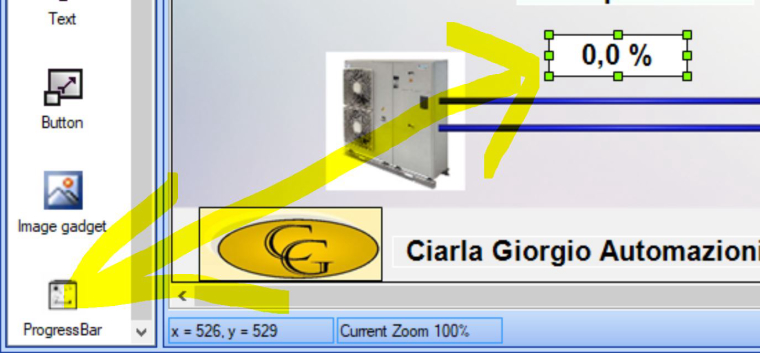
sorry i was making graphics changes..and now the progress bar does not appear to me and i can erroe when i save ..
how can I do?
-
@tomas_hora
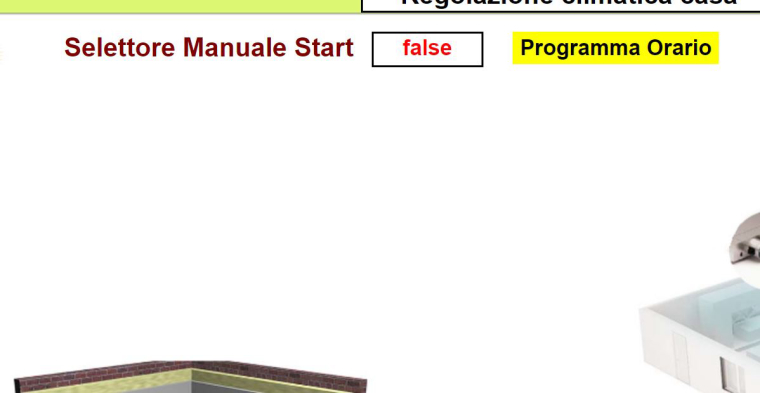
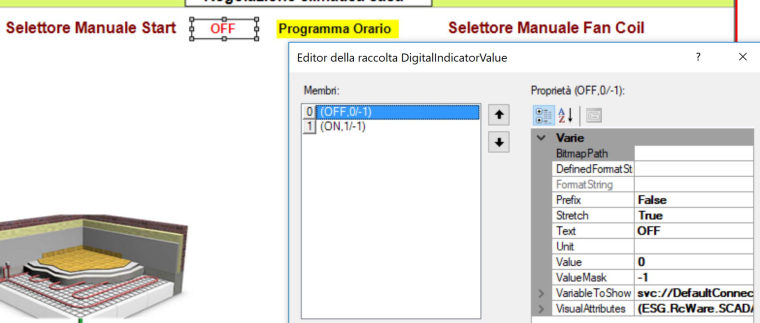
I would like to know some technical information .. Like ever in the HMI study when I program a group to see a state I write in English ..
but online gives me the inscription in English?

-
@TriathletC Is the variable that you attached the same as variable that you want to see?
-
@TriathletC And to your first query I think that best way will be to reinstall HMI. Because it's hard to say what you've changed and transcribed.
-
@David thank you