@tomas_hora: It works somehow, read further what I mean by somehow. But first let me share this small guide, so anybody else can benefit from it (wouldn't it be great to have it on UniPi KB?):
In order to get info from PRO1/PRO380 energy meter in Node-RED you'll need:
- Connect everything properly trough RS485 line (in my case Neuron L203 <=> PRO1 <=> xS11)
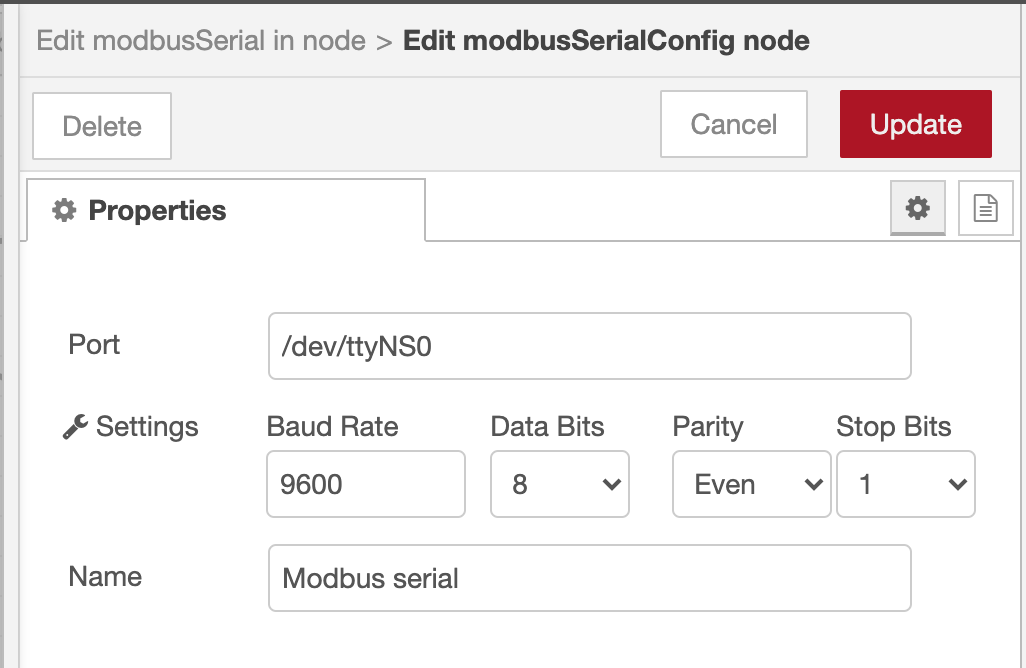
- Using DIP switches on L203 and xS11: switch on terminator resistor on both ends of RS485 and change the baud rate to 9600 and parity to Even (as PRO1 cannot do anything faster than 9600 bps).
- Configure Modbus ID on PRO1 (I've used 101 in my case).
- Optional in case you have xS11 or other Modbus device: Configure Modbus ID on xS11 (I've used 5 in my case).
Software part
- Download and use official UniPi image with Node-RED
- Optional in case you have xS11 or another extension: Enable it in evok.conf by uncommenting proper lines and don't forget to add information about baud rate and parity
- Open Node-RED and install node-red-contrib-serial-modbus library (or you can use node-red-contrib-modbus one, which is more complex, yet more powerful as well).
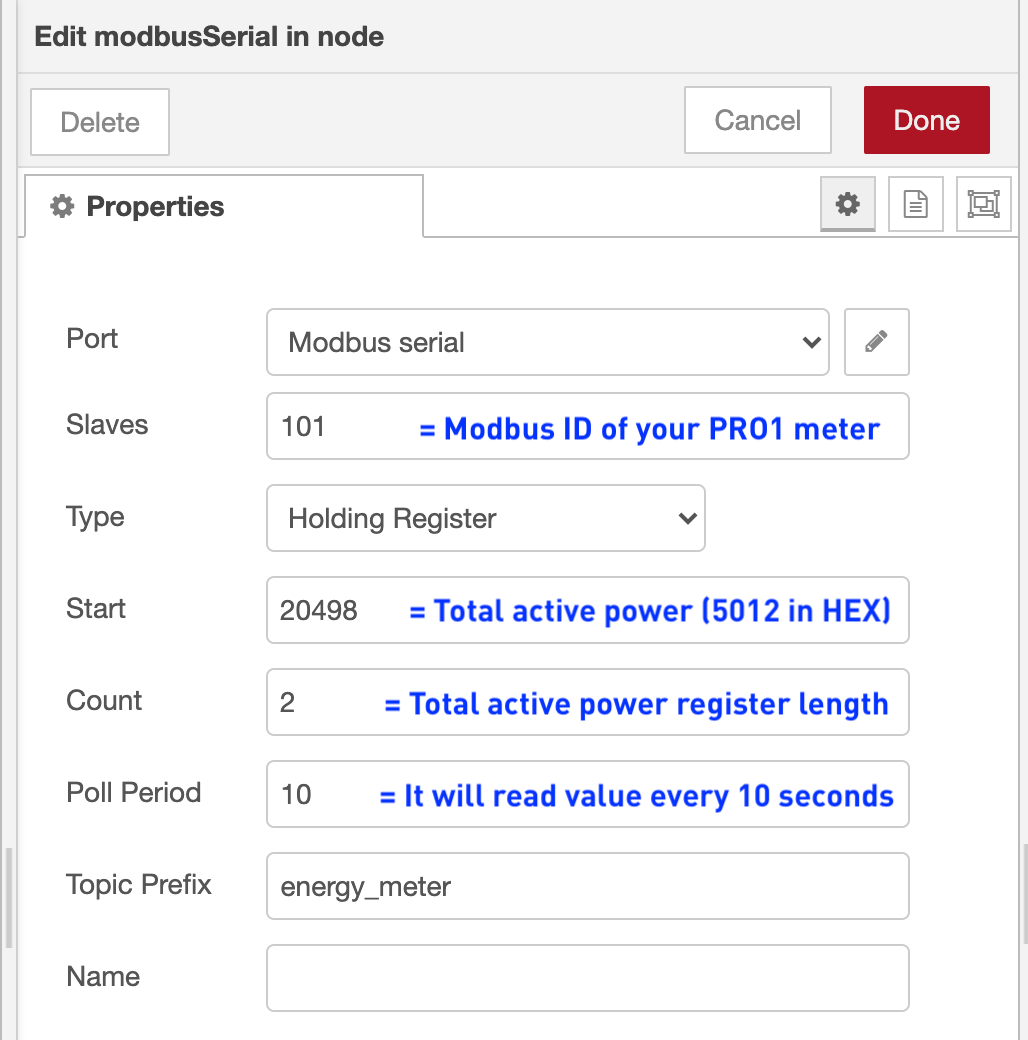
- Add Modbus-Serial In node and configure it accordingly:
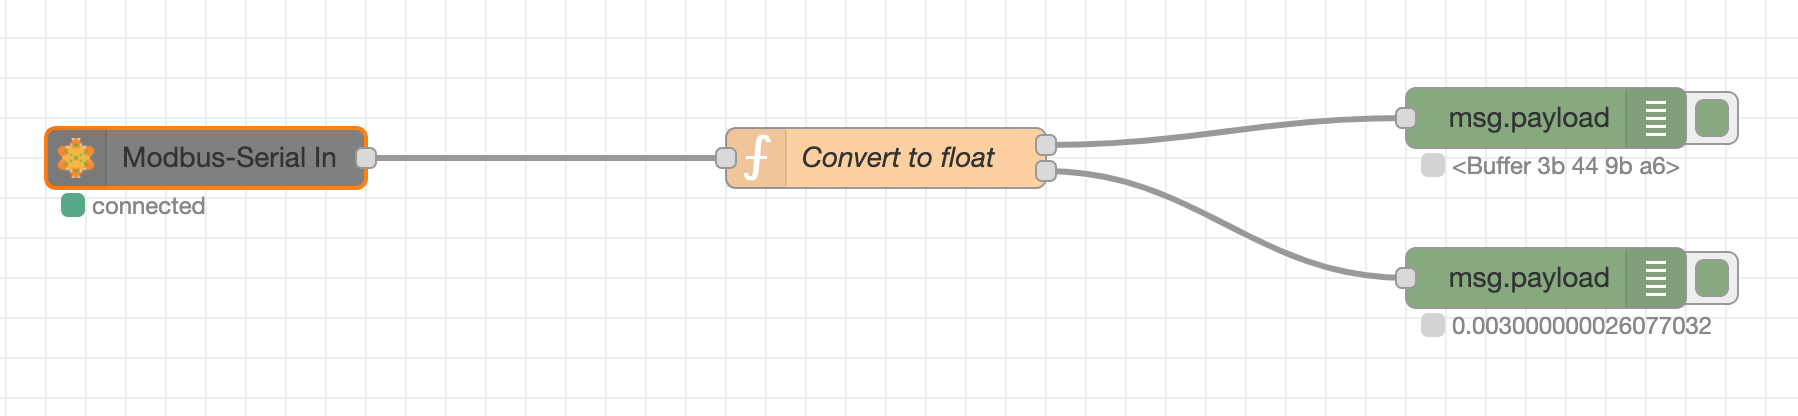
- Create a simple flow to get the values:
[
    {
        "id": "383d6eea.dbaec2",
        "type": "tab",
        "label": "Modbus",
        "disabled": false,
        "info": ""
    },
    {
        "id": "4d5ae639.855088",
        "type": "modbusSerial in",
        "z": "383d6eea.dbaec2",
        "port": "f7aabf02.b9fda",
        "slaves": "101",
        "start": "20498",
        "count": "2",
        "dtype": "holding",
        "period": "10",
        "topic": "energy_meter",
        "name": "",
        "x": 120,
        "y": 100,
        "wires": [
            [
                "b1147fac.29b03"
            ]
        ]
    },
    {
        "id": "d382f138.d56c",
        "type": "debug",
        "z": "383d6eea.dbaec2",
        "name": "",
        "active": true,
        "tosidebar": true,
        "console": false,
        "tostatus": true,
        "complete": "payload",
        "targetType": "msg",
        "statusVal": "payload",
        "statusType": "auto",
        "x": 790,
        "y": 80,
        "wires": []
    },
    {
        "id": "b1147fac.29b03",
        "type": "function",
        "z": "383d6eea.dbaec2",
        "name": "Convert to float",
        "func": "var msgalt = {payload: msg.payload.readFloatBE(0)};\n\n\nreturn [ msg, msgalt ];",
        "outputs": 2,
        "noerr": 0,
        "initialize": "",
        "finalize": "",
        "x": 460,
        "y": 100,
        "wires": [
            [
                "d382f138.d56c"
            ],
            [
                "bbf909bc.60a118"
            ]
        ]
    },
    {
        "id": "bbf909bc.60a118",
        "type": "debug",
        "z": "383d6eea.dbaec2",
        "name": "",
        "active": true,
        "tosidebar": true,
        "console": false,
        "tostatus": true,
        "complete": "payload",
        "targetType": "msg",
        "statusVal": "payload",
        "statusType": "auto",
        "x": 790,
        "y": 160,
        "wires": []
    },
    {
        "id": "f7aabf02.b9fda",
        "type": "modbusSerialConfig",
        "z": "",
        "port": "/dev/ttyNS0",
        "baud": "9600",
        "data": "8",
        "parity": "even",
        "stop": "1",
        "name": "Modbus serial"
    }
]
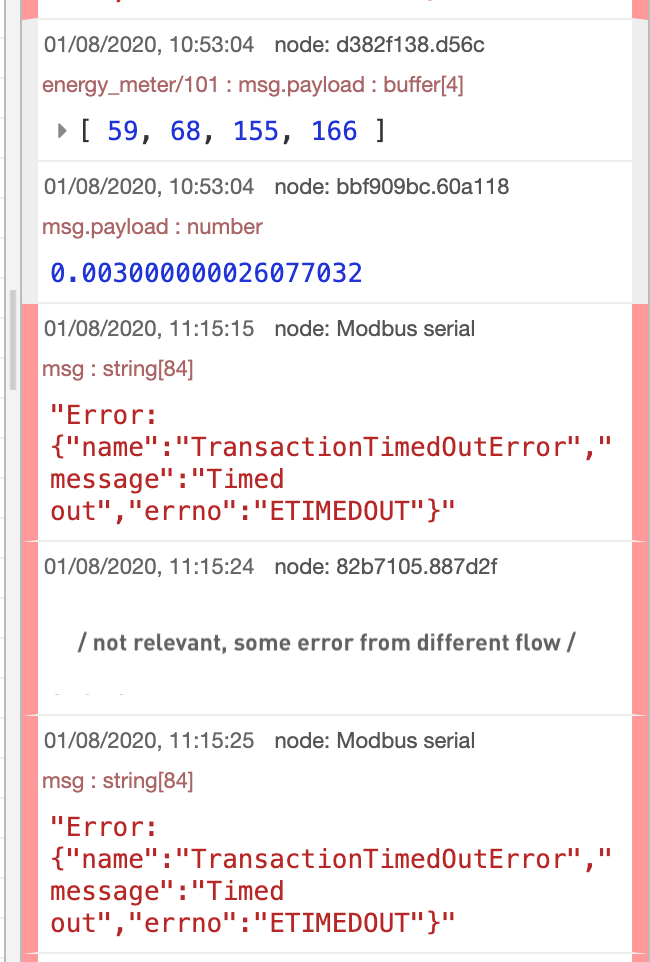
- Deploy the flow and in the debug tab, you should see messages with the active power: in this case it's about 30 mA (the first message is raw output, the second message is converted with readFloatBE(0) function):
Whee, now you should be able to read any register you want :)
To answer fully to @tomas_hora : I am having trouble with lots of timeouts (as you can see from the image above) - about 70% of requests end up as timeouts. And this is the ONLY application/flow running on my Neuron at this time. This issue is happening with node-red-contrib-modbus library as well - even when you set timeout as high as 5 seconds, you still get this insane timeout rate.
As I am not an HW guy, my guess is that the Modbus gets somehow overloaded by something, because when you access Neuron directly through the web interface, you can see that all RO on xS11 are reacting with 1-2 seconds delay compared to the state when Node-RED is not reading anything from the serial port.
Unless you have a better idea where the glitch might be, I am going to experiment with ditching xS11 for a moment. The next thing I could think of is to keep energy meters on separate RS485 bus (through some 3$ USB converter) - in order not to slow down and jeopardize the traffic between Neuron and xS11.